This is Part 2 of a series. Read Part 1: Pandas vs Polars in Production - Performance Comparison for the background on the Polars migration.
After migrating from Pandas to Polars, CPU performance improved dramatically—but a memory problem persisted. Despite extensive debugging, I couldn’t identify the root cause. So I made a pragmatic decision: architect around it.
This is the story of splitting a monolithic Python application into a Go orchestration service with Python workers, not because I fully understood the problem, but because I needed production to be stable.
The Problem
The application was a data aggregation service running 24/7 as a Kubernetes pod:
- Stack: FastAPI + Uvicorn web server, asyncio-based scheduler, Polars data processing
- Frequency: Pipeline ran every 2-2.5 minutes
- Environment: 2 CPUs, 3 GB RAM limit
The Polars migration solved the CPU bottleneck, but revealed a deeper issue: the long-running Python process was accumulating memory over time. Memory usage grew steadily until eventually hitting the 3 GB limit, causing Kubernetes to kill the pod with an OOM error. This happened with both Pandas and Polars—the problem wasn’t the DataFrame library, it was the architectural pattern of a persistent Python process doing cyclical heavy computation.
On staging (low traffic), it was stable. In production (constant HTTP requests + scheduled computation), memory grew predictably until failure.
The Debugging Journey
I tried everything I could think of:
Profiling tools:
memory_profilermemray- Custom metrics tracking RSS growth over time
Code-level attempts:
- Explicit
delstatements after DataFrame operations - Manual
gc.collect()after each pipeline run - Verified no circular references
- Checked for unclosed database connections
- Reviewed all async task cleanup
Architecture experiments:
- Tried different ASGI servers (Uvicorn, Hypercorn, Gunicorn with Uvicorn workers)
- Experimented with different executor patterns (thread pool, process pool)
- Adjusted garbage collection thresholds
Nothing consistently solved the problem. Memory would still grow, just at different rates.
The Decision
After weeks of debugging without a definitive answer, I made a pragmatic choice: if I can’t fix it, I’ll architect around it.
The core insight: separate computation from orchestration. Use Go for what it’s best at (HTTP servers, scheduling, concurrency), and use Python for what it’s best at (data processing). Most importantly, make Python processes short-lived so memory issues can’t accumulate.
The New Architecture
Both services run in the same Kubernetes pod, but with distinct responsibilities:
Go Service:
- HTTP server for API requests
- Cron-based scheduler (triggers every 2-3 minutes)
- Spawns Python subprocess via
exec.Command - Receives completion notification via NATS
- Reads computation results from local file
- Serves processed data from memory (static data refreshed periodically)
Python Worker:
- Runs as a subprocess when triggered
- Performs heavy DataFrame computation with Polars
- Writes results to local file
- Publishes completion event to NATS
- Terminates immediately after
Data Flow:
- Go scheduler triggers on cron schedule
- Go spawns Python subprocess
- Python computes, writes results to local file, publishes NATS event
- Go receives NATS message, reads file, loads data into memory
- Go serves HTTP requests from in-memory data (avg ~40 microseconds response time)
- Repeat every 2-3 minutes
The key design choice: Go holds the processed data in memory as essentially static data that gets refreshed periodically. This makes HTTP responses extremely fast (sub-millisecond, typically ~40μs) while Python only runs when computation is needed.
The Implementation
Here’s the pseudo-code showing the key concepts (simplified for clarity):
Go Scheduler (pseudo-code)
package main

type ComputedData struct {
    // Your data structure
}

var cachedData *ComputedData

func runPythonComputation(ctx context.Context) error {
    // Spawn Python subprocess
    cmd := exec.CommandContext(ctx, "python3", "compute.py")
    output, err := cmd.CombinedOutput()

    if err != nil {
        log.Printf("Python failed: %v", err)
        return err
    }

    return nil
}

func handleNATSUpdate(msg *nats.Msg) {
    // Read result file written by Python
    data := readFile("output.json")

    // Parse and cache in memory
    var newData ComputedData
    json.Unmarshal(data, &newData)

    cachedData = &newData
    log.Println("Data refreshed")
}

func main() {
    // Connect to NATS
    nc := connectNATS()
    nc.Subscribe("computation.complete", handleNATSUpdate)

    // Setup cron scheduler (runs periodically)
    scheduler := setupCronScheduler()
    scheduler.AddJob(func() {
        ctx := contextWithTimeout(90 * time.Second)
        runPythonComputation(ctx)
    })
    scheduler.Start()

    // Start HTTP server (serves from cachedData)
    startHTTPServer()
}
Python Worker (pseudo-code)
#!/usr/bin/env python3
import polars as pl

def main():
    try:
        # Heavy Polars computation (synchronous)
        result_df = perform_computation()

        # Write to local file (synchronous)
        result_data = result_df.to_dict()
        writeToFile("output.json", result_data)

        # Notify Go via NATS (async only for this part)
        async_publish_to_nats("computation.complete", "done")

        exit(0)

    except Exception as e:
        print(f"ERROR: {e}")
        exit(1)

if __name__ == "__main__":
    main()
Results
The memory problem disappeared immediately.
Before: Monolithic Python Architecture
Memory behavior from the old architecture (Pandas/Polars with long-running Python):
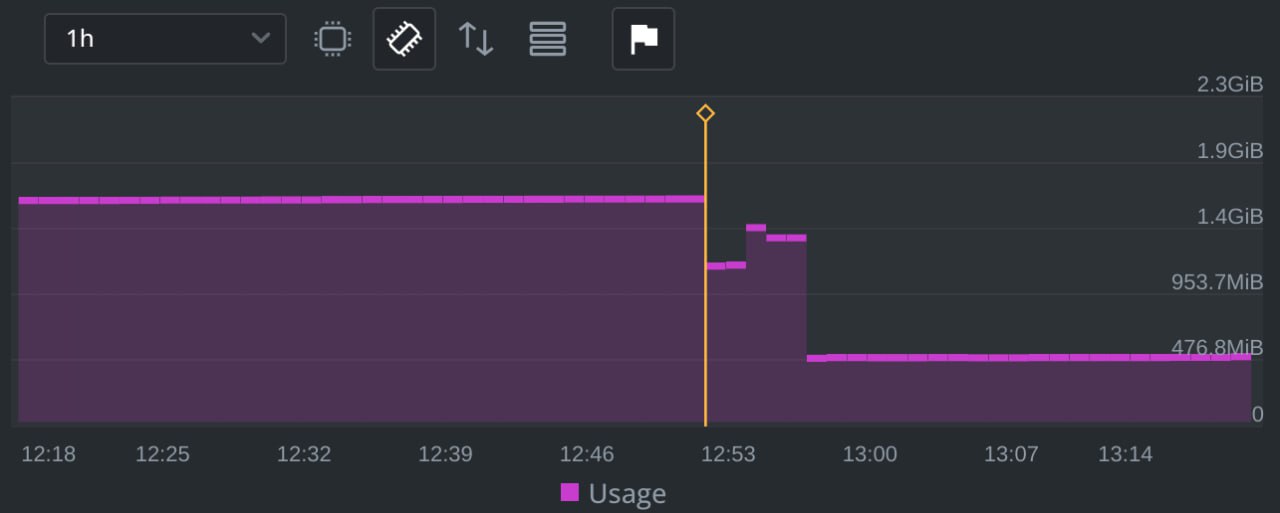 Memory usage steadily growing over time
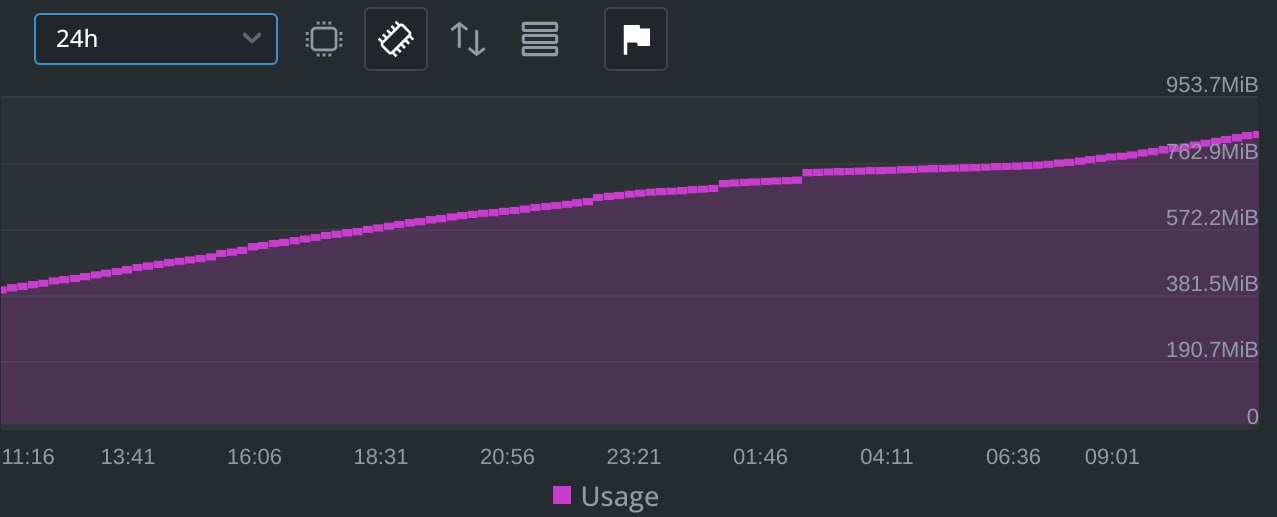 Eventually hitting resource limits
Characteristics:
- Memory started at ~300 MB
- Grew to 2.5-3 GB over several hours
- OOM kills every 6-12 hours in production
- Unpredictable resource consumption
- Frequent crashes requiring restarts
After: Go + Python Workers Architecture
Current production metrics:
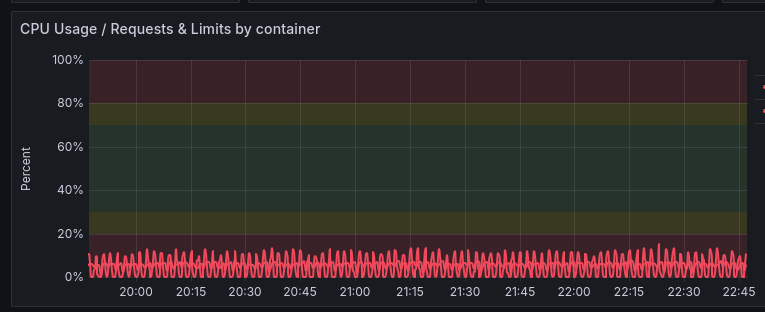 CPU spikes during computation, then returns to baseline
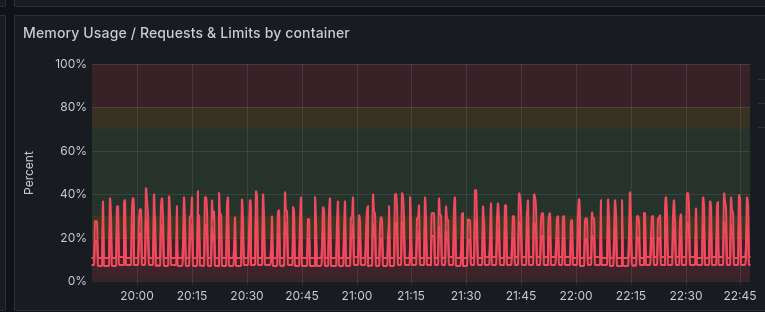 Memory spikes during Python execution, immediately returns after termination
Characteristics:
- Pod baseline (Debian-based image + Go): ~200 MB
- During Python execution: spikes to 700-800 MB
- After Python terminates: returns to ~200 MB baseline
- No memory growth over time
- Zero OOM kills since deployment
- Predictable, repeating pattern every 2-3 minutes
The Difference
The key improvement is visible in the graphs: no upward trend. The old architecture showed memory climbing steadily until failure. The new architecture shows controlled spikes that return to baseline—the memory graph looks like a heartbeat, not a staircase.
Additional benefits:
- Submillisecond response times: Go serves from memory with ~40μs average latency
- Faster startup: Go service starts in milliseconds vs seconds for Python
- Better observability: Separate logs and metrics for orchestration vs computation
- Fault isolation: If Python crashes, Go logs it and continues; the next run gets a fresh process
- Easier debugging: Each Python execution is isolated; issues can’t compound across runs
- Resource efficiency: Python interpreter only consumes resources during computation
Trade-offs
This architecture isn’t without costs:
Process spawn overhead: Each pipeline run spawns a new Python process (~100-200ms overhead). For my 2-minute interval, this was negligible. For sub-second jobs, it might matter.
Increased complexity: Two codebases, two deployment artifacts, inter-process communication. More moving parts mean more things that can fail.
No state reuse: Can’t cache data between runs in Python. Everything must be loaded fresh each time. (In my case, data was always fetched fresh anyway, so this didn’t matter.)
Communication limitations: Subprocess communication is simpler than in-process. Complex data passing between Go and Python would require serialization overhead.
Lessons Learned
1. Sometimes you need to change approach when debugging stalls
I spent weeks trying to definitively identify the memory issue. When traditional debugging wasn’t yielding results, changing the architecture became the pragmatic path forward. This isn’t advice to skip root cause analysis—debugging is essential—but when you’re blocked and production is suffering, architectural changes can unblock you while you continue investigating.
2. Match architecture to constraints
Long-running Python processes with cyclical heavy computation are a known challenge. Short-lived processes are a well-established pattern for a reason—they’re simple and robust.
3. Process boundaries are powerful
Processes provide automatic cleanup, isolation, and predictability. Don’t discount the simplicity of “just restart it.”
4. Separate computation from orchestration
This is basic separation of concerns, but easy to overlook when prototyping. Go excels at orchestration. Python excels at data processing. Let each do what it’s good at.
5. Pragmatism over perfectionism
Production needs to be stable. If the perfect solution is weeks away and you have a working alternative now, ship the alternative.
When to Use This Pattern
This Go + Python architecture works well when:
- You have periodic heavy computation (not continuous streaming)
- The computed data can be treated as periodically-refreshed static data
- You need extremely fast read performance (serving from memory)
- Computation is stateless or state can be externalized
- Process spawn overhead is acceptable for your frequency
- You need rock-solid stability over maximum efficiency
- You have resource constraints where every MB matters
Don’t use this pattern when:
- Computation runs continuously or very frequently (< 1 second intervals)
- You need real-time computation per request (can’t serve cached data)
- You need to maintain complex state between runs in memory
- Process spawn overhead is significant relative to computation time
- Your team doesn’t want to maintain multiple languages
- Data must be absolutely real-time (can’t tolerate 2-3 minute staleness)
The likely cause, in hindsight
I never caught the leak with a profiler while it was happening, but I’m now fairly confident about the mechanism.
Python doesn’t reliably return freed memory to the operating system. When objects are freed, the memory goes back to Python’s allocator and the underlying C allocator—not to the OS—so the process’s resident memory (RSS) stays at its high-water mark. On top of that, a workload that repeatedly allocates large, differently-sized DataFrame buffers fragments the heap: the freed regions are still there, but they’re scattered, so they can’t always satisfy the next big contiguous allocation. When they can’t, the allocator asks the OS for more. Run after run, peak RSS ratchets upward and never comes back down—until it crosses the pod’s 3 GB limit and Kubernetes OOM-kills the process.
That also explains the staging-versus-production gap: under light load, with smaller and less frequent allocations, the ratchet was slow enough to stay under the limit. Under production load it wasn’t. It’s consistent with the problem showing up under both Pandas and Polars, too—the culprit isn’t the DataFrame library, it’s a long-lived process doing cyclical heavy allocation.
This is exactly the failure mode that short-lived processes neutralize. The heavy allocation now happens in a worker that exits after every run, and process exit hands all of that memory straight back to the OS. Nothing accumulates, so there’s nothing to grow.
Worth calling out: the fix came from the short-lived worker, not from Go specifically. A thin Python server calling a disposable Python worker—python + python instead of go + python—would have addressed the core of the problem the same way, since the heavy per-run allocation is what gets isolated and reclaimed. A long-lived Python HTTP server would still be exposed to slow drift under constant traffic, just without the big allocations feeding it, so that split would have taken care of most of the growth on its own. Go earned its place for the rest: millisecond startup, ~40 µs in-memory serving, easy concurrency, and tighter memory behavior in the process that never dies.
Conclusion
I couldn’t pin the leak down with a profiler while production was burning, so I designed around it—and landed on an architecture where the problem can’t occur. In hindsight the cause was almost certainly Python holding onto fragmented memory it never returned to the OS; short-lived worker processes make that impossible to accumulate.
Sometimes the best solution isn’t fixing the bug—it’s designing a system where the bug can’t exist.
Production has been stable ever since.